Benchmarking LLM Provider Latency for Production Routing Decisions
Measure TTFT, ITI, and tail latency under real load to route LLM requests correctly.

LLM API spending jumped from $3.5 billion to $8.4 billion between late 2024 and mid-2025. At that spending level, a bad routing decision isn't just a slow response for one user, it's a cost problem multiplying across millions of requests. This piece is about measuring latency the right way, so routing rules hold up once real traffic hits them, not just in a clean test.
Most teams still lean on provider dashboards that show one number: average end-to-end response time. That number hides everything that matters. It blends fast requests with slow ones, quiet hours with peak load, short prompts with long ones, and hands back a figure that looks calm even when a chunk of real users are staring at a spinner for four extra seconds. Add to that the gap between marketing benchmarks, run on small prompts at low concurrency from a single region, and what a production request actually goes through, and you get routing rules built on numbers that were never describing your traffic in the first place.
Three specific failures show up over and over. Teams route to a provider with a great average time-to-first-token, and that provider falls apart under load, with tail latency nobody measured. Teams ignore the pace tokens arrive after the first one, so a response starts fast and then crawls, which users read as broken even though the model is still working. And teams benchmark on the median (p50) when the real question is what the slowest 1 to 5 percent of sessions feel like, because those sessions are often the highest-value ones (long documents, big customers, complex prompts). None of this gets fixed by asking providers for better dashboards. It gets fixed by measuring the right signals yourself, under conditions that actually look like your workload.
The three latency signals that actually matter for routing: TTFT, ITI, and tail latency
Three numbers drive almost every latency-based routing decision worth making. Get comfortable with them individually before trying to combine them into a rule.
Time to first token (TTFT) is the clock from when a request goes out to when the first token of a streaming response comes back. It's the number that decides whether an interaction feels instant or sluggish, because a user's sense of "fast" comes almost entirely from how long they stare at nothing before text starts appearing. TTFT should be the primary signal for interactive chat, copilot-style autocomplete, and anything with a visible loading state. It matters a lot less for batch jobs, async summarization, or any pipeline running offline where nobody's watching a screen wait on it.
Inter-token interval (ITI), sometimes described as tokens per second, is the cadence at which tokens show up once the first one lands. This is what makes a response feel like it's flowing versus stuttering. Benchmarks like BenchLM report raw throughput, with Celeris-1 hitting 1,418 tokens per second as of September 2026, representing something close to the current speed ceiling. ITI is basically the per-token inverse of that figure, and it matters most on long-form output: documents, generated code, multi-step reasoning chains where the user is reading along as text appears. A provider can post an excellent TTFT and still feel slower overall, if its ITI is jerky, because the user notices the stall in the middle of the response more than they noticed the half-second delay at the start. A provider with a moderate TTFT but steady, consistent ITI often wins on perceived speed even with a "worse" headline number.
Tail latency, specifically p95 and p99 under real concurrency, is the latency the slowest 5 percent and 1 percent of requests actually experience. This is the number that breaks SLAs while averages look perfectly fine. Live profiling research on search providers (Chu et al., 2026, the LQM-CONTEXTROUTE work) tracked 270 calls across three providers and found distinct latency shapes even when every call succeeded, meaning providers that look identical at the median can diverge sharply at the tail. Single-request synthetic tests never surface this, because tail behavior only shows up under load, when queuing and contention start to bite.
These three signals don't always point the same direction. A provider can be excellent on TTFT and mediocre on ITI, or fine at the median and rough at p99. Routing rules need to state, explicitly, which signal governs which class of request, because there's no single number that captures speed correctly across every use case.
How provider latency actually behaves under production load, and why it shifts
Latency isn't a fixed property stamped on a model. It moves with time of day, regional demand, silent model version swaps, and provider infrastructure changes that nobody announces on a status page.
The open-source llm-bench tool captured a spread across providers at one point in time, useful not as a current leaderboard but as a picture of how latency, cost, and quality trade off against each other. In that sample: llama-3.1-70b posted 0.9 seconds latency at $0.0009 per 1,000 tokens, the fastest and cheapest option, but with an 8.4 percent hallucination rate and a 0.5 percent error rate. gpt-4o came in at 1.2 seconds and $0.0075 per 1,000 tokens, with a 4.2 percent hallucination rate and 0.1 percent errors. claude-sonnet-4 measured 1.8 seconds and $0.0090 per 1,000 tokens, slower in this sample but with a 2.1 percent hallucination rate and no recorded errors. deepseek-chat was slowest at 2.1 seconds and cheapest-adjacent at $0.0014 per 1,000 tokens, with a 6.8 percent hallucination rate and 0.3 percent errors.
Treat those figures as illustrative of the shape of the trade-off, not as today's ranking. Any team using this for a real decision needs to rerun something like it against its own workload. What the table shows past the raw numbers is the pattern: the fastest provider in that snapshot wasn't the most accurate, and the cheapest one carried the highest error rate. Route purely on speed, ignoring quality, and the fast, cheap, wrong answers start winning the routing decision.
Provider behavior drifts in ways that call for specific planning:
- Model version swaps, made without much announcement, that quietly shift TTFT and ITI profiles overnight
- Regional endpoint congestion that spikes during peak traffic windows in a given geography
- Rate limit throttling that shows up first as latency creep, well before it turns into hard failures
- Infrastructure incidents that degrade tail latency long before the median (p50) shows any sign of trouble
The LQM-CONTEXTROUTE research makes a point that generalizes past search providers: a routing policy that's purely reactive and blind to quality lets a fast, low-quality provider win the routing decision on speed alone. Treating latency as a straightforward additive bonus in a scoring formula, stacked against quality, invites this collapse. Latency needs to be treated more like a cost incurred per service cycle than a reward to be maximized, or the router ends up optimizing for the wrong thing. And because provider behavior keeps moving, a routing rule set against a one-time benchmark is already stale the moment it ships. Measurement has to be an ongoing job, not a setup task checked off once.
What a valid latency benchmark methodology looks like
A benchmark that doesn't match your workload isn't measuring your workload. That sounds obvious, and it gets ignored constantly.
Prompt length has to reflect what production actually sends, not a fixed short test string, because TTFT scales with prompt length and context size. Concurrency has to be at realistic requests-per-second levels, not a sequential single-threaded loop, since tail latency simply doesn't appear until there's real contention for provider capacity. If the application streams responses, measure streaming; if it also has non-streaming calls, measure those separately, because they stress different parts of the pipeline. Run the test from the same region production traffic comes from, and run it across multiple time windows, since latency variance across a day is part of what you're trying to capture, not noise to average away.
Per request, capture:
- TTFT, in milliseconds, from send to first token
- Tokens per second after that first token (the ITI proxy)
- Total end-to-end latency
- Error type and rate, split out by cause: timeout, rate limit, model error
- Input and output token counts, so latency and cost can be normalized per token
Report distributions, always, never a single mean. p50, p90, p95, and p99 for both TTFT and total latency, with error rate tracked as its own separate line. A provider with a strong p95 but a 0.5 percent error rate is failing a different kind of SLA than one with a slightly worse p95 and zero errors, and collapsing those into one score erases the distinction that actually matters for routing.
Run the test long enough to catch variance across a provider's normal load cycle. A five-minute burst test won't show the degradation that shows up over a sustained hour of traffic, which is exactly the pattern production will hit.
Gateway overhead itself is small, adding around 11 microseconds per request at 5,000 requests per second. Vendor-stated figures put gateway-layer overhead around 11 microseconds per request at 5,000 requests per second, which sits orders of magnitude below provider inference latency, running in the hundreds of milliseconds. That means a well-run latency benchmark is measuring provider behavior almost entirely, not gateway behavior. Separately, published throughput comparisons between open-source gateways, run against mocked LLM backends rather than live providers, measure raw gateway request-handling speed. Numbers like that describe gateway throughput under synthetic load, not end-to-end response time a user experiences, and shouldn't be read as a guide to which setup produces faster real responses.
The output of all this shouldn't be a single ranking table. It should be a latency profile per provider, per request class, that a routing engine can actually use.
Translating latency profiles into routing rules that hold under real conditions
A routing engine has to decide, in milliseconds, which provider handles an incoming request, before any upstream call goes out. That decision window rules out computing anything clever from raw benchmark data on the fly. Rules have to be pre-specified, built from the latency profiles gathered earlier, not derived fresh each time a request lands.
Three routing strategies lean on those profiles differently:
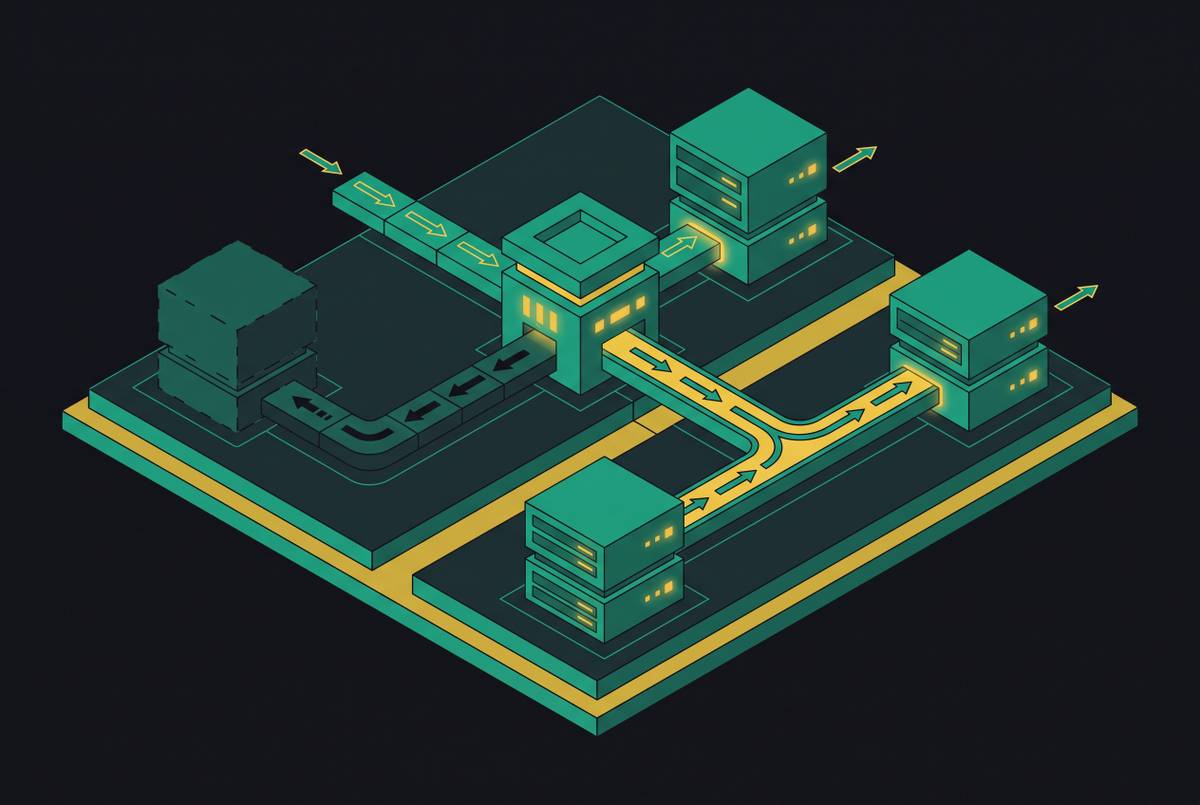
Load balancing across regional endpoints of the same model should weight distribution using p50 TTFT by region, not split traffic evenly. Equal weighting only makes sense if latency profiles are actually equal, and they usually aren't. Fallback chains should trigger on p99 breach or a rising error rate, not on p50 drift. A provider whose median looks perfectly healthy while its p99 quietly climbs is the exact case where a reactive, median-based failover fires far too late, after users already felt it. Cost-based routing with a latency floor sends simpler requests to cheaper, faster models, the low-cost end of the per-token pricing tier, only when their p95 latency actually clears the SLA for that request class. If it doesn't clear it, the savings aren't worth the tail-latency risk.
None of that works without classifying requests first. Interactive and streaming traffic should treat TTFT as primary, ITI as secondary, and p95 as the hard SLA boundary. Long-form generation should flip that: ITI (tokens per second) becomes primary, and TTFT matters much less once generation is underway. Batch and async work cares about total throughput and error rate; TTFT is close to irrelevant there.
A key failure mode to guard against: when providers differ in quality and a router scores speed and quality additively, a fast, low-quality provider can win the combined score outright. The router then hits its latency target while silently degrading the actual task output. The fix isn't a smarter formula, it's a quality floor the router simply isn't allowed to trade away for speed, no matter how attractive the latency number looks.
Rules decay. The benchmark that produced a routing rule is already out of date by the time that rule is live, since providers keep shifting underneath it. That argues for logging TTFT and ITI on every production request going forward, not just during benchmark runs, and for alerting on p95 drift relative to the baseline that generated the rule in the first place, rather than relying on a fixed absolute threshold that never updates.
One failure mode deserves calling out directly: opaque automatic model swapping. If a routing layer or a provider silently changes which model actually serves a request, the latency and quality profile shifts underneath a rule that has no idea anything changed. Routing decisions need to be intentional and logged, with the exact model and provider recorded against every request, or the whole measurement effort upstream is wasted.
Where caching fits into latency strategy, and the limits of treating it as a routing substitute
Semantic caching returns a response in under 5 milliseconds, against 2 to 5 seconds for live inference on the same prompt. For repeated or near-repeated requests, that's the single biggest latency win available, and no routing rule gets anywhere close to it. Teams reporting cost and latency reductions in the 50 to 70 percent range generally get there by combining semantic caching with model routing together, not either technique alone.
Requests that repeat across a user base, commonly cited above 30 percent of traffic in production systems, are the caching target. For that slice, routing latency stops mattering entirely, because the cache answers before any provider decision even gets made.
Caching has real limits. Novel prompts, which make up the majority of traffic in a lot of agentic and generative workflows, simply can't be served from cache; routing is the only lever left for them. Cache hit rate falls as prompt diversity rises, and multi-step agentic workflows tend to generate exactly that kind of variable prompt. And a cache miss that falls through to a badly chosen provider still produces the same tail-latency problem discussed above, cache or no cache.
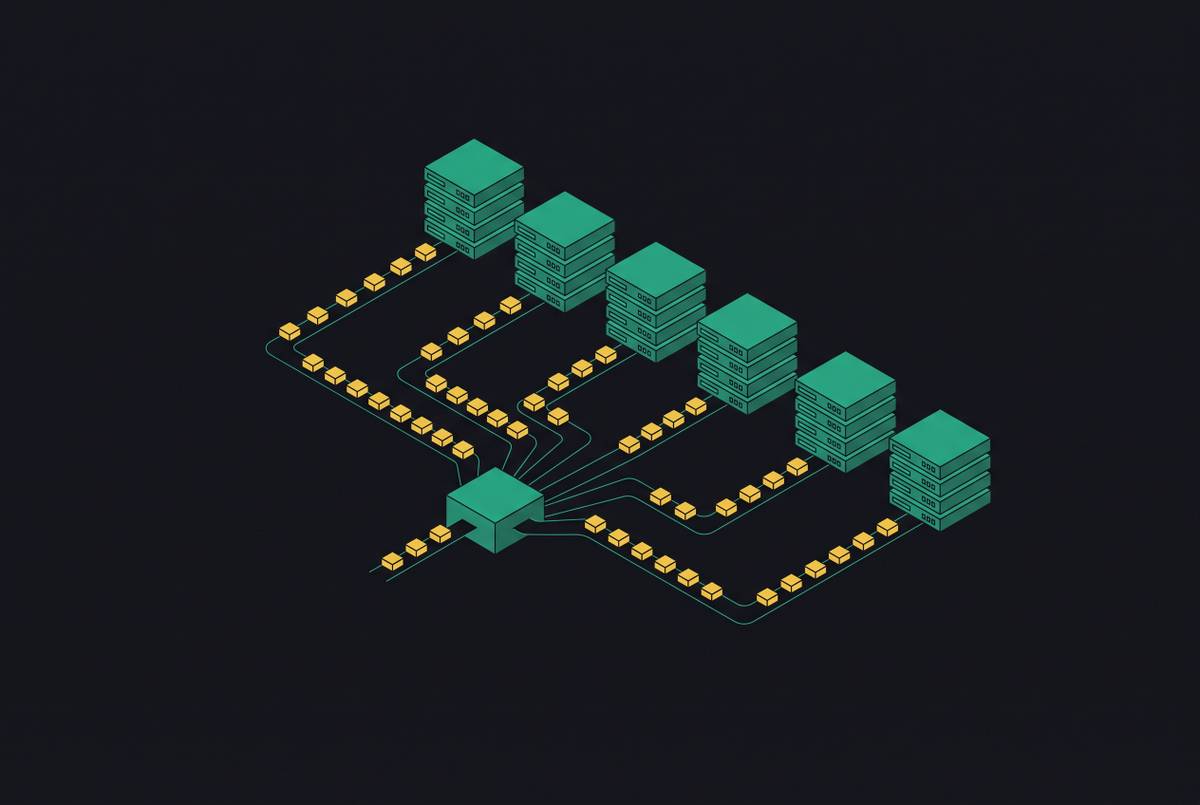
Architecturally, caching and routing belong in the same layer, the gateway, so a cache check happens before any routing decision gets made. A hit short-circuits the whole routing path; a miss triggers the latency-aware routing logic described earlier. Both decisions, cache hit or miss and which provider served a miss, should get logged together. That combined log is the data that actually improves both policies over time, not just one of them in isolation.
The infrastructure layer that makes continuous latency-aware routing operational
Routing logic belongs in an infrastructure layer, not scattered across application code. Spread per-provider latency tracking, fallback chains, and rule evaluation across a dozen application services, and behavior turns inconsistent fast, with no shared view of what's actually happening across requests.
A gateway layer built for latency-aware routing needs a few things in place. Per-request logging of TTFT, ITI, total latency, provider, model, token counts, and error type, because without that data routing rules can't be validated or improved, only guessed at. Real-time health signals per provider endpoint, since a routing engine needs live data to trigger fallback on p99 degradation, not a batch report generated hours later. Fallback chain configuration with provider-level circuit breakers, distinguishing a transient blip from sustained degradation, so the system doesn't thrash back and forth between providers on every minor hiccup. And support for routing rules scoped by request class, since interactive and batch workloads carry different latency SLAs, and the routing engine has to understand request metadata to apply the right rule to the right request.
Teams face a real build-versus-buy decision here. Self-hosted routing and gateway tools provide the primitives, request logging, fallback chains, health checks, but they shift real operational weight onto whoever runs them: maintaining the gateway itself, keeping provider integrations current as APIs change, and scaling the thing as traffic grows. That's a legitimate trade-off, not a free one, and it should be sized against the cost of getting routing wrong in the first place, given what's now at stake in LLM API spending across the industry.