Gateway-Layer Observability vs. Provider Dashboard Visibility
Gateway-layer observability reveals cost and reliability gaps that provider dashboards hide.
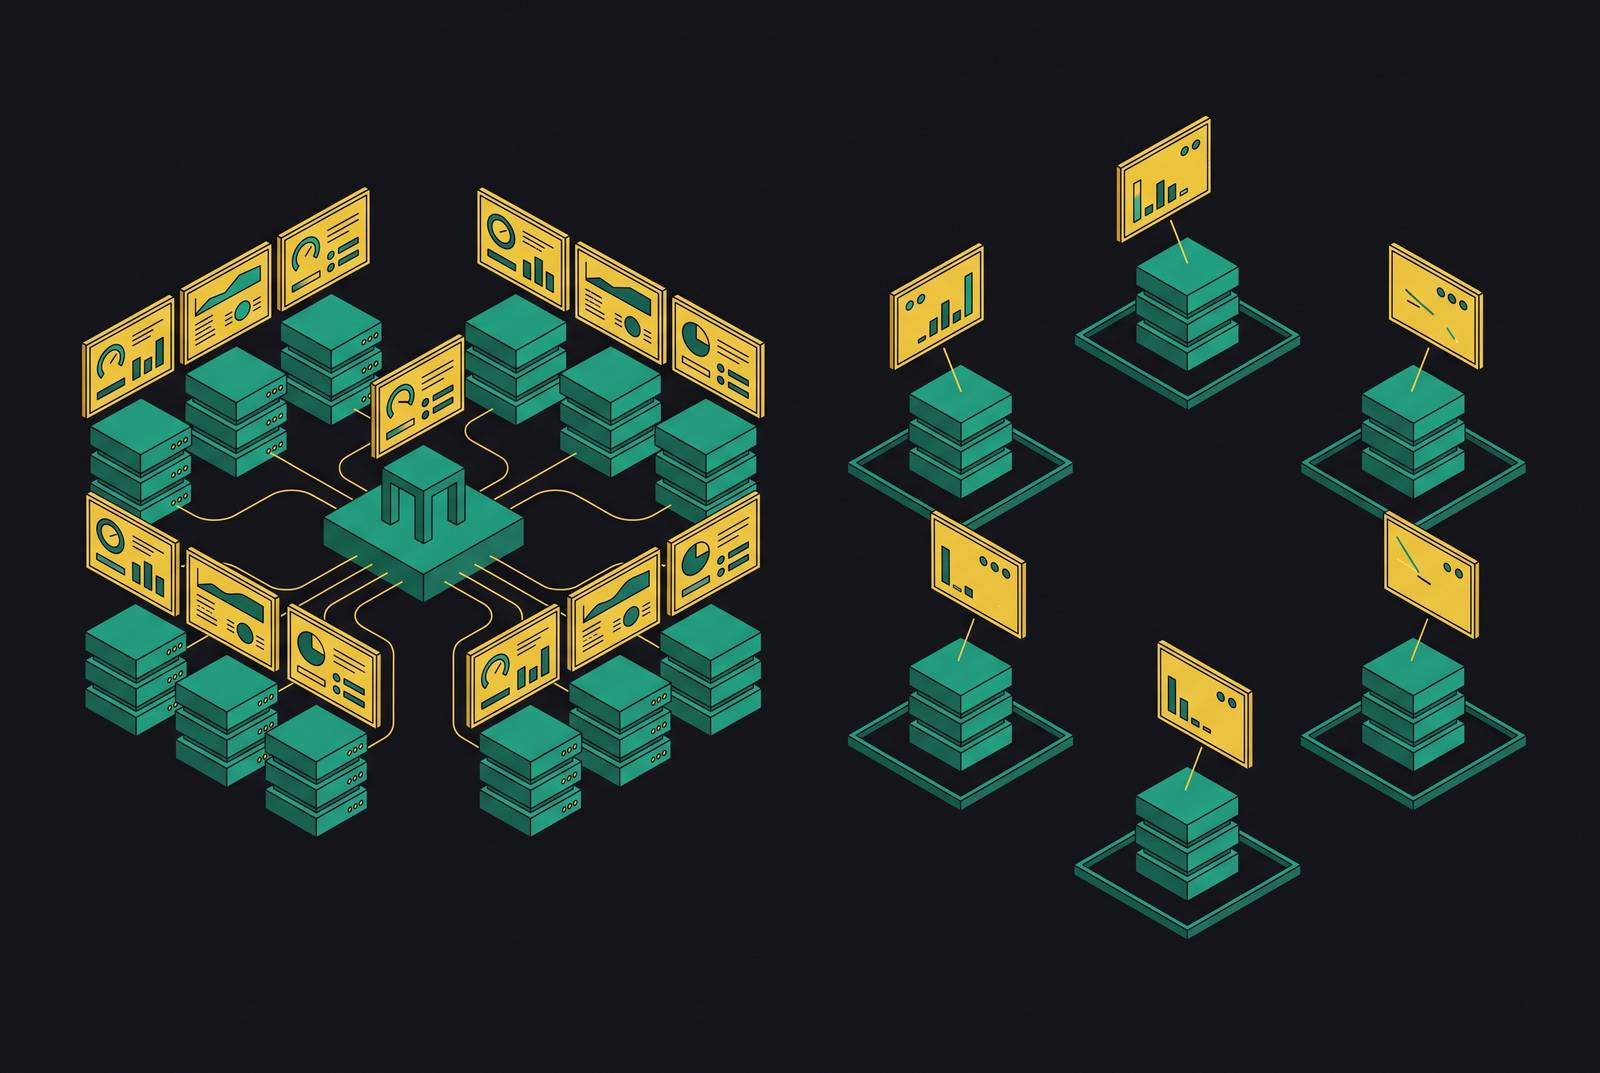
Provider dashboards show what happened inside one company's servers. Gateway-layer observability shows what happened across the whole stack: every provider, every model, every fallback chain. Most teams get this backwards, assuming better logging means bolting a monitoring tool onto each provider integration, when the fix has to sit in the request path itself, before the call goes out. That's where cost overruns pile up unnoticed, where reliability failures hide until users complain, and where compliance gaps sit until an auditor asks a question nobody can answer.
How production AI stacks actually look in 2025 and 2026
Nobody runs one model anymore. Teams call OpenAI for one task, Anthropic for another, Google's models for a third, mixing in Mistral, Groq, or Cohere depending on the workload, since different models win at different jobs, and the price gap between them is wide enough that routing traffic to the cheapest model that can still do the job is a real budget decision now.
That price spread deserves a second look. The price gap between production-ready models is wide enough that picking the wrong one for a high-volume task turns the overage into a line item finance asks about, usually right after it's too late to fix quietly.
Every provider relationship comes with its own dashboard, its own API keys, its own billing cycle, its own log format. None of them talk to each other, and that's the part teams underestimate until it costs them. Multi-provider is the default architecture now, and treating it as an edge case is the first mistake most teams make, while the share of engineering teams building multimodel applications through an AI gateway keeps climbing.
Agentic workloads make the fragmentation worse. A single user action can fan out into five or six model calls across three different providers, and no individual provider dashboard sees that whole chain. Most teams stitch the picture together by hand: exported CSVs, spreadsheets, a monthly reconciliation ritual nobody enjoys. Some teams don't stitch it together at all, and not knowing is the expensive part.
The specific visibility gaps that live between provider dashboards
Start with latency. Each provider reports its own server-side number, measuring time inside its own infrastructure, and that number says nothing about what the user actually experienced: the network hops, the retries, the cold start on a rarely used model. The gap only closes once latency gets measured from the point the request originates, not from the point the provider decides to start the clock.
Fallback behavior is where things get genuinely confusing. Say a primary provider times out and a backup model picks up the request; the primary provider's dashboard logs a failure while the fallback provider's dashboard logs a success. Neither shows the two-second delay the user actually sat through, and neither shows that a failure occurred upstream at all.
Cost attribution below the org level barely exists in provider dashboards, since they aggregate spend to an account or an API key and stop there. Which internal team burned that budget? Which product feature drove the spike? Which customer's usage pattern got expensive? None of it is visible. Token spend gets bucketed into "compute," a catch-all nobody investigates, and an engineer trying to check whether a prompt rewrite actually saved money has no way to verify it.
Quality is the blind spot people underestimate most, and it's the one that should worry teams more than cost does. A provider log confirms a response came back, but it says nothing about whether that response was correct, safe, or matched company policy. There's no quality dimension in the log at all, just a status code sitting there looking useful and telling you nothing.
The audit trail problem comes next. Compliance work needs a record of which data went to which model at what time. Split that record across three or four dashboards with different formats and different retention windows, and it functionally doesn't exist, not in a form a compliance officer can use under time pressure.
Semantic caching adds one more wrinkle worth sitting with. When a cached response gets served instead of a fresh provider call, the provider never sees the request. Provider dashboards undercount total request volume as a result, and worse, they overstate cost per outcome, since the requests served for free never show up anywhere as savings.
Budget enforcement is the last piece, and it's the one that matters most. Provider dashboards show spend after it happened, while real budget control, hard limits, per-team quotas, alerts before the money's gone, requires something sitting in front of the request: a check that happens before the money moves.
What gateway-layer observability can see that providers cannot
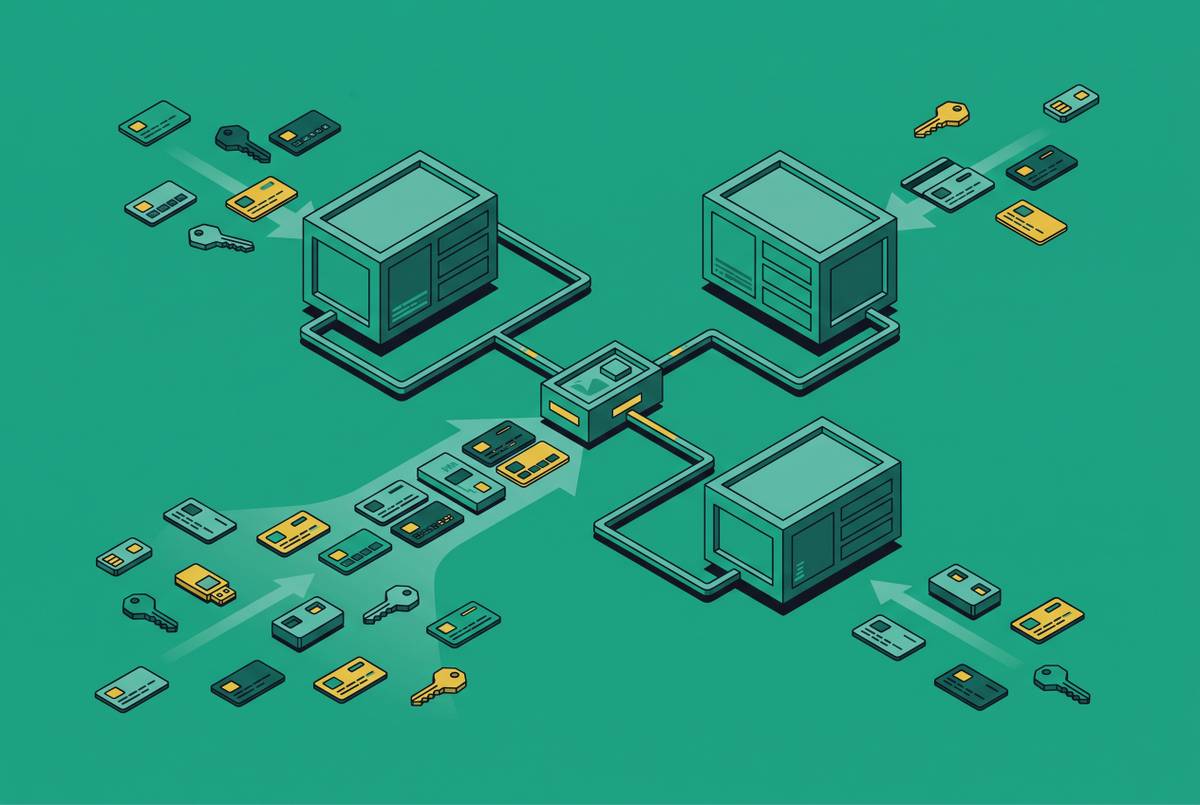
A gateway sits between application code and every provider a team uses. Every outbound call passes through it, which gives it a complete, unified view of cross-provider traffic, all of it, at once, in the same format.
What that unlocks is specific. The gateway tracks the full request lifecycle, from the moment application code fires a call to the moment the first token comes back, across every provider and model in use. It compares p50 and p95 latency across providers using client-perceived numbers instead of each provider's self-reported figures. It logs fallback chains in full: which provider got tried first, why it failed or got skipped, which provider ultimately answered, how long the whole sequence took start to finish.
Token counts break into input, output, and reasoning tokens where applicable, sliceable per request, per team, per environment, per virtual key. Cost attribution follows whatever granularity a team actually needs: by feature, by customer, by deployment stage. Routing decisions get logged too, which rule fired and why a particular model got picked, a record that supports both debugging and after-the-fact cost audits.
Cache hit rates show up clearly: what share of traffic got served without touching a provider, and what that saved in dollars. Budget consumption tracks in real time against defined limits, catching overspend before it happens instead of after. PII redaction events log at the metadata level: what got detected, what got masked, which policy triggered it, without the raw sensitive payload ever sitting in the log.
Gateway deployments track live p50/p95 latency, cost, and quality signals across more than two dozen providers simultaneously, in production. No single provider was ever going to build that view, because none of them were built to see past their own walls. The gateway normalizes the record whether the underlying call went to OpenAI, Anthropic, or an open-weight model, so teams get one query syntax, one retention policy, one export format for SIEM or compliance tools.
Cost overruns: why they happen and what catches them at the gateway
AI API spending at the enterprise level has gone from a few billion dollars a year to a multibillion-dollar line item in under two years. Across teams that hit real scaling, a meaningful share report actual costs blowing past forecasts, often significantly, which is the predictable result of measuring spend after the fact instead of during it, and not a subtle miss. The gap between watching a bank statement and watching a checkout screen shows up here directly.
The structural reason provider dashboards miss it: they show what was already spent, at the account level, not at the team or feature level where someone could actually act on it. By the time the number shows up, the decision window has already closed.
A handful of patterns show up again and again, and they're almost always avoidable in hindsight. A verbose prompt template ships and multiplies across high-volume traffic; the per-request cost looks trivial until it's multiplied by millions of calls, and nobody notices until the invoice lands. A feature gets bumped to a premium model during development for testing convenience and never gets reverted before launch. Agentic loops call the same expensive model repeatedly with no clean stopping condition, and the provider dashboard just shows a pile of successful requests with no way to tell whether half of them were unnecessary. A high-volume, low-variance use case never gets a cache layer configured, so nearly identical requests hit the provider fresh, every single time.
Visibility alone doesn't stop any of this; enforcement does. A budget limit set at the gateway blocks a request before the cost is incurred, while a provider dashboard can only record the cost after the fact. Once model spend becomes a line item the CFO actually reads, the team that can show real-time attribution by feature and by team keeps its credibility, and the team reconstructing the story from month-end CSV exports is always a billing cycle behind the conversation, and being a billing cycle behind is how budgets die quietly.
Reliability failures that cross-provider observability prevents
Provider outages aren't rare events. Every major LLM provider has had stretches of degraded availability, and a team running on a single provider wears that outage as its own, in front of its own users.
Fallbacks only help if someone actually knows they fired. The fallback provider's dashboard shows a clean success and says nothing about the failed attempt that came before it, and without a gateway tracing the whole sequence, an engineering team can go days without realizing its primary provider was degraded, right up until support tickets start piling up.
Latency spikes are sneakier than outright failures. A provider that suddenly takes three seconds instead of half a second doesn't register as an error anywhere in its own logs; it shows up as "completed," same as always, no flag, no warning. Only a layer measuring client-perceived latency catches that kind of quiet degradation as it happens, rather than after a customer complains.
Multi-step agentic workflows make the blast radius worse. A latency spike at one link in the chain doesn't just slow that call, it delays every step downstream of it, and that blast radius is only visible to whatever layer can see the entire chain end to end.
Good routing needs a feedback loop, not a static config file written once and forgotten. Routing logic has to respond to live provider health, error rates, and latency trends in real time, and that only works if the gateway is measuring continuously across every provider it touches. Observability has to be built into the gateway itself, because when something does go wrong, post-incident debugging needs to answer which provider, which model, which request, which response, fast, and that reconstruction is nearly impossible when the logs live in separate systems with different formats and different retention clocks.
Compliance gaps that neither provider dashboards nor application logs close
Sensitive data can appear in AI prompts in ways teams don't anticipate, and most teams have no reliable way to confirm what's actually leaving their perimeter before it hits a provider's servers. It's an uncomfortable gap to sit with, and a common one.
Provider retention isn't zero by default. Provider accounts often come with data retention terms that teams don't fully account for, and getting to stricter data-handling arrangements typically requires a negotiated enterprise agreement, not a checkbox in a settings menu. Absent that agreement, data sits somewhere for some period, whether a team accounted for it or not.
Provider dashboards can't answer the questions that actually matter for compliance. Was PII or PHI present in this specific request? Did a redaction policy fire, or fail to? Which data category went to which model, under which rule? Was a request that should've been blocked by a residency rule actually blocked? Answering questions about an organization's internal policy was never a provider dashboard's job, and expecting it to become one is wishful thinking.
Under frameworks like GDPR and HIPAA, sending personal data to an external provider raises regulated processing questions that organizations have to be prepared to answer. The organization has to demonstrate it controlled what got sent and where, and that demonstration needs a record an auditor can actually inspect, not a promise that things were probably fine.
Here's the specific failure mode that actually gets companies in trouble, the one nobody remembers to check. Teams redact PII from the obvious place, the prompt text, then miss it everywhere else: tool call parameters, function arguments, the telemetry spans built for latency debugging. A voice agent might correctly withhold a card number from its spoken response while quietly storing that same number in six different places across its own observability tooling. That's the default outcome of redacting one field and assuming the job's done.
A compliance-grade audit log needs a few things provider dashboards simply don't offer: immutability once written, retention configured to match the longest regulatory requirement that applies, metadata logging of redaction events without storing the raw sensitive data itself, clean export to a SIEM, and one unified record across every provider instead of a separate log per relationship. Data residency rules, like "personal data only goes to an EU-resident endpoint," only work if the layer making the routing decision is the same layer enforcing the policy, and that's the gateway. No individual provider can see the other providers a team is also using, so no individual provider can enforce a rule that spans all of them.
Why "just add a monitoring tool" doesn't close the gap
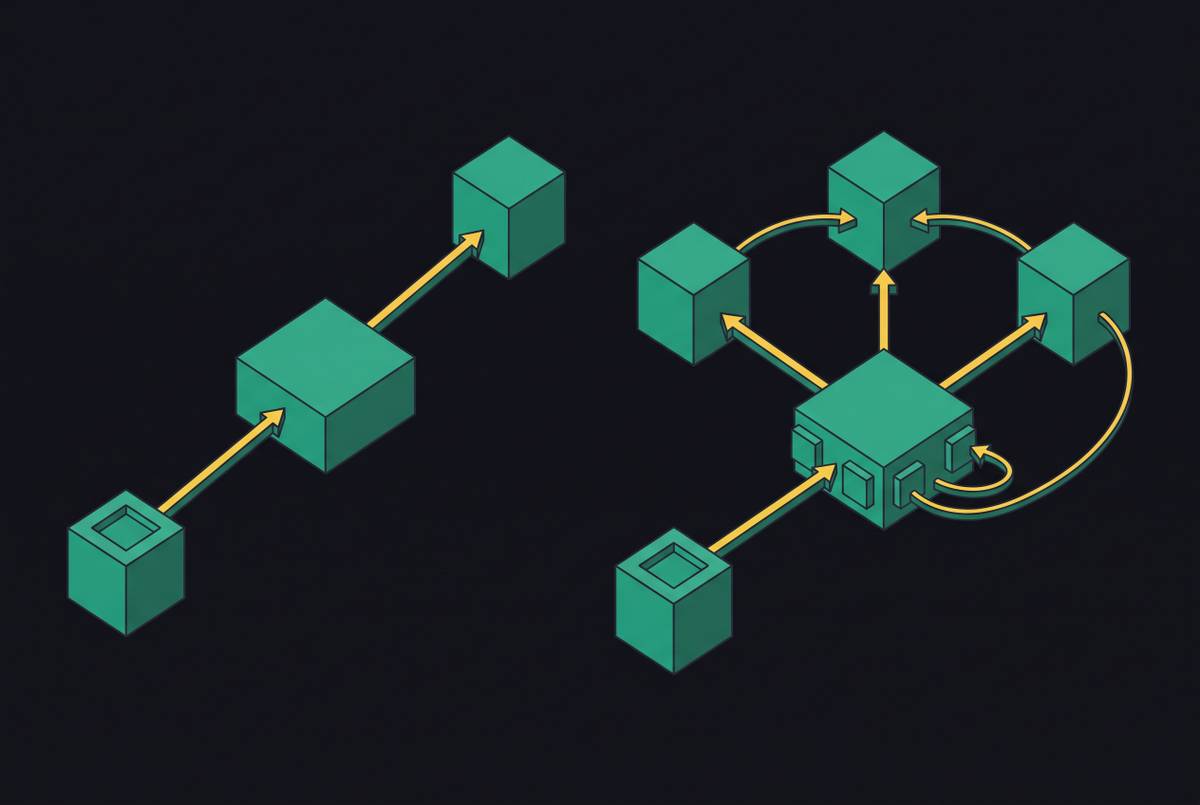
The obvious workaround: wire up tracing on each provider integration separately, forward the logs to a central observability platform, build dashboards on top. Sounds reasonable on a whiteboard, but in practice, it recreates the exact problem it was supposed to fix, and this is where most teams go wrong, mistaking log volume for actual coverage.
Instrumentation done this way lives per-integration. Every service calling a provider needs its own tracing code, so coverage is only as good as the least disciplined team writing that code, and there's always one. Log forwarding introduces its own gaps too: a request that fails before a response comes back may never produce a complete entry in the application layer at all.
Enforcement is the real dealbreaker, and no amount of dashboard polish gets around it. A monitoring tool sitting outside the request path can see that spend crossed a threshold, but it can't block the request that's about to breach it, because by the time it sees the data, the request already went out the door. The same problem shows up with PII: redaction has to happen before the payload leaves the organization's perimeter, and an observability tool receiving forwarded logs is looking at data that's already sitting on a provider's servers.
Trace correlation across providers needs a shared request ID generated at the point where the call originates. Bolted-on monitoring tools inherit whatever IDs each separate integration happens to generate, so stitching a full trace back together after the fact is closer to guesswork than reconstruction.
All of this adds up to real engineering overhead: separate instrumentation per provider, upkeep every time a provider changes its API, formats that were never designed to match, reconciled by hand. That cost compounds every time a new provider gets added to the stack, and enforcement and observability need to sit in the same layer, full stop; a good story after the fact is not the same thing as prevention.
What gateway-layer observability looks like in practice across leading tools
The gateway landscape in 2026 spans managed services, self-hosted open-source options, and specialized observability layers, and picking between them comes down to one question: where does observability sit relative to enforcement? Most tools log what happened, and that's a real capability, but it's the easier half of the job. Fewer can actually stop a request before it becomes a cost or a compliance problem, and that second half is the one that matters when something's actually on fire. A tool that only does the first half is a dashboard with a nicer skin.
Sorting the shallow integrations from the real ones comes down to a handful of questions, the same ones worth asking of any tool under consideration. Does cost attribution reach down to team, project, and individual virtual-key granularity, or does it stop at the org level like a provider dashboard would? Are latency numbers client-perceived, or just relayed from whatever the provider claims? Does PII redaction logging capture the metadata, the policy fired, the category detected, without storing the raw sensitive payload? Are budget limits enforced in the request path, blocking a call before it goes out, or just reported after the spend already happened?
Langfuse is worth naming here: MIT-licensed, self-hostable, built with strong tracing for teams that want to own their observability infrastructure rather than route it through a third party. That's a real option for teams with the engineering headcount to run it themselves. Whichever tool a team lands on, the questions above are what separate genuine gateway-layer observability from a dashboard wearing a new coat of paint, and tools that fail those questions are missing the enforcement layer entirely, the layer that was the whole point.