Routing-Layer Telemetry as the Foundation for Per-Team LLM Spend Dashboards
Routing-layer telemetry enables real-time, granular LLM spend tracking by team.

Real-time AI spend tracking by team, project, model, and provider requires one thing most organizations don't have: a single point where every request is logged before the provider bills for it. When each service calls OpenAI, Anthropic, or Bedrock directly, there's no shared layer that can tell you who spent what, on which model, for which project. There's only an invoice at the end of the month, totaling the spend in aggregate, with no breakdown by team and no explanation of why the number looks the way it does.
The failure starts with fragmented metadata. Without a shared layer, each team that drives AI spend writes its own retry logic, stores its own provider keys, and many teams report no cost data whatsoever. There was never a consistent place to apply governance, which produced fragmented visibility, unpredictable costs, and no consistent governance across model usage.
Three patterns compound this over time. And vendor lock-in accumulates quietly through both of these: model names baked into code, prompts engineered around one model's quirks, and logic that only works with one provider's response format.
The problem sharpens the moment a second anything shows up: a second model, a second team, a second provider, a second compliance question.
The routing layer as the only source of full attribution metadata
The gateway is the single instrumented control point through which every model request passes, and that position is what makes it the only layer where attribution metadata can be collected consistently, across every team and every provider, without depending on each application to self-report its own usage.
The architecture is straightforward: application calls gateway, gateway calls provider. Instead of each service reaching out to OpenAI or Anthropic on its own, it calls the gateway, which selects the model, applies cost and policy controls, and returns a normalized response. A team can swap providers without touching application code, and because attribution logic lives at the gateway rather than scattered across services, it stays out of application code.
What the gateway sees that nothing else in the stack sees: which team or virtual key initiated the request, which model and provider actually served it (which can differ from what was requested if a fallback fired), input and output token counts, latency at each step of the request, the error type if a fallback was triggered, and whether a cache hit avoided a provider call. No provider invoice captures this. No application log captures all of it consistently across teams.
Token-based accounting sits at the center of this, because it's the actual unit providers bill on. Two requests to the same endpoint can differ by orders of magnitude in cost depending on how many tokens they consume, so request-per-minute rate limiting cannot control AI spending. Counting requests tells you nothing about cost. If you track tokens in and tokens out, separately, per request, you see everything.
This fragmentation is precisely why routing-layer solutions exist: a gateway sitting between every application and every provider can collect team, project, and cost metadata in one instrumented control point. A virtual key can be restricted to specific models, budgets, or request types, which makes team-level attribution a property of the system rather than a policy someone has to remember to follow.
Agentic workflows make this more urgent, not less. A single user request might trigger Claude Opus for complex reasoning, Haiku for fast classification, an MCP server for data retrieval, and a second model for output verification, all chained together to produce one response. If a gateway doesn't govern that entire chain, the spend from one user action scatters across multiple provider logs with no common identifier tying it back together.
The telemetry signals that matter for spend attribution, and why each one is necessary
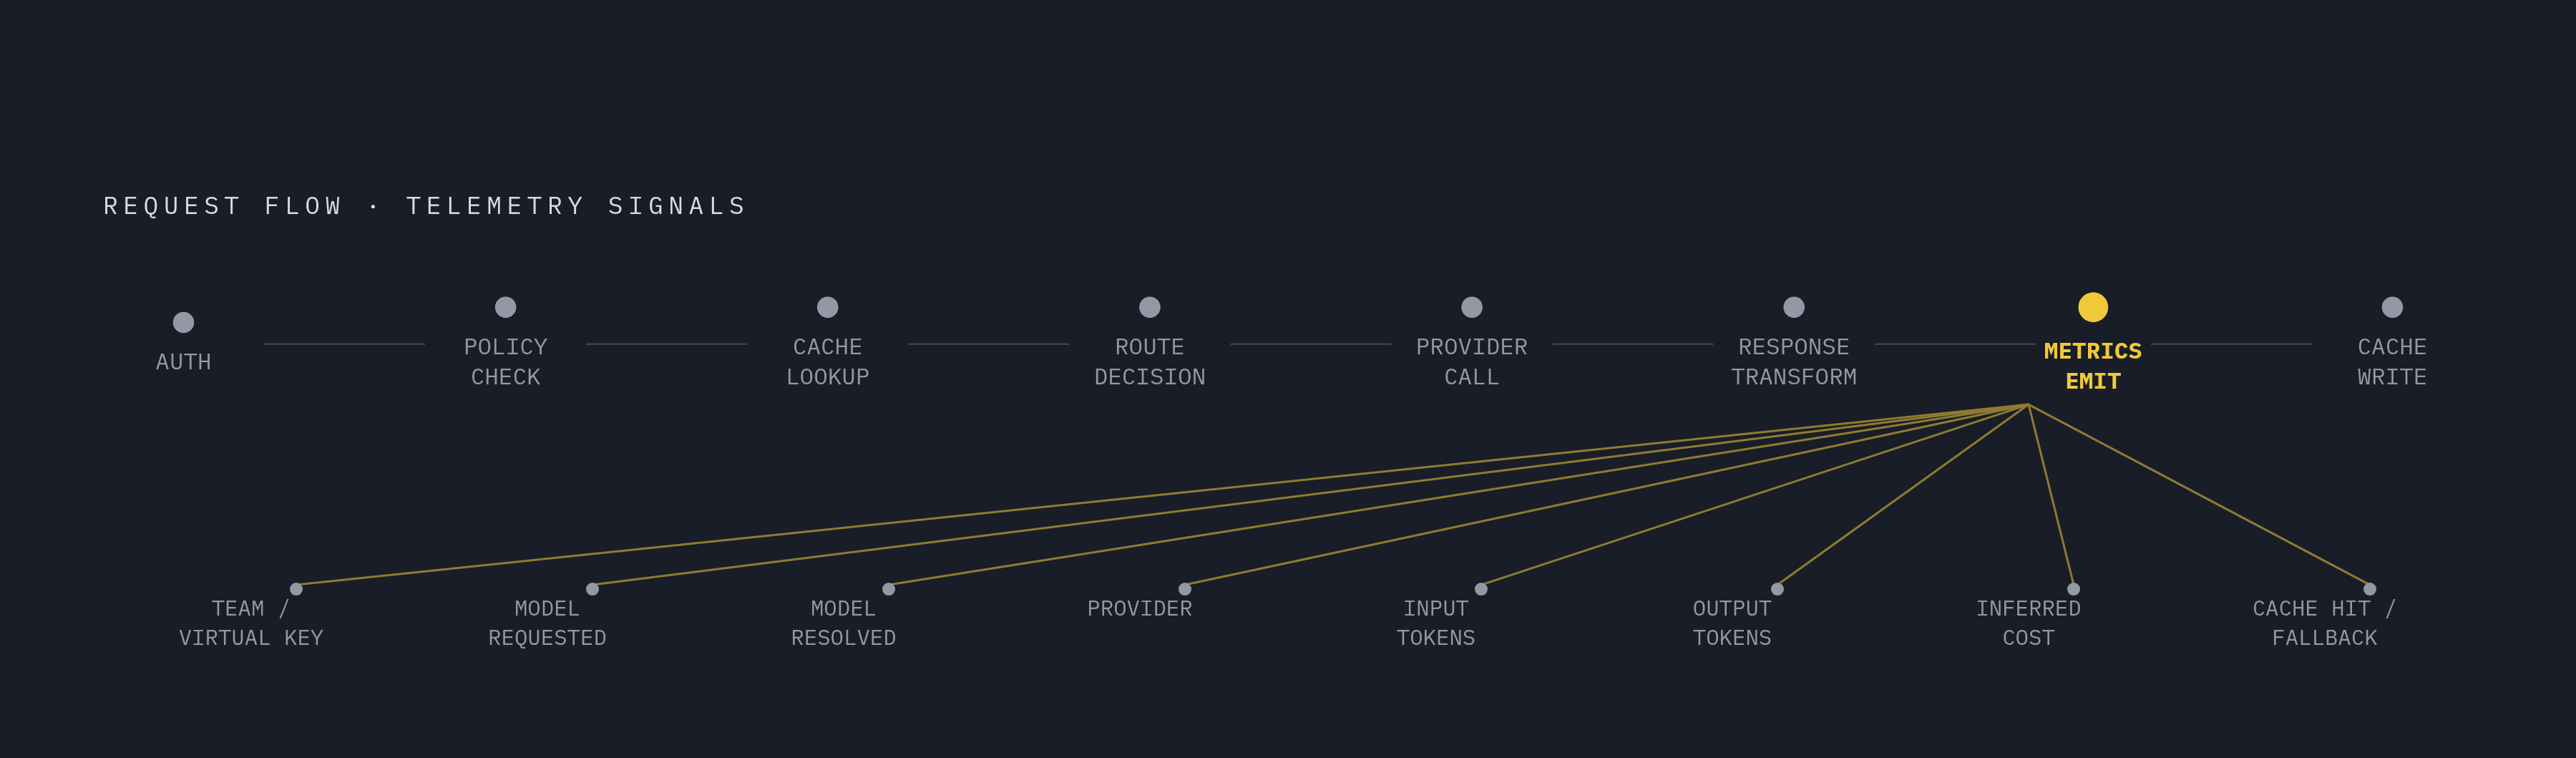
Not all telemetry helps with spend attribution. The signals that matter are the ones that let someone answer who spent how much, on which model, for which project, and whether that spend was justified.
A usable attribution record needs the team or workspace identifier, pulled from the virtual key, a project or feature tag set by the calling application, the model alias requested alongside the model actually resolved, the provider (Anthropic, OpenAI, Google, Bedrock, and so on), input and output token counts tracked separately, the inferred cost at the time of the call, a cache hit flag, and a fallback indicator recording both the intended and actual provider when one was used.
Token counts need to be split by direction because providers price input and output tokens at different rates, usually with output priced higher. Collapsing both into a single "tokens used" number produces a cost estimate that's wrong in proportion to how verbose the responses are. A team with a long system prompt looks cheap on output and expensive on input, and that split is the only way to see it.
The cache hit flag matters as a spend signal, not just an efficiency metric. A high cache hit rate for a team or project is direct evidence of savings, quantified in dollars. A dashboard that leaves cache hits out understates what the caching infrastructure is actually worth and overstates how dependent the team is on the provider.
All of this gets produced by one request flow: authentication, then a policy check against eligible providers, then a cache lookup, then the route decision, then the provider call, then a response transform, then the metrics emit, then the cache write. Metrics get emitted after the response comes back, so the attribution record reflects what actually happened, not what was originally intended.
Gateway telemetry into a spend ledger
Per-request telemetry is the raw input. The spend ledger is the usable output. Getting from one to the other requires a deliberate pipeline that routes events into durable storage and rolls them up into the aggregates that dashboards actually query.
That pipeline runs in three stages, as a design pattern rather than any single product's specific implementation. In the enforce stage, budget state lives in fast storage, and counters get checked before each provider call, so a team that has used up its monthly allocation gets rejected at the gateway and the overage is caught immediately.
The ledger has to be real-time to be worth anything. Metering every call with a team and feature tag, and enforcing budgets inline rather than just reporting on them, produces a real-time ledger of tokens in, tokens out, cost per feature, and cache-hit savings.
Reporting-only pipelines are a trap: gateways that meter spend but never block traffic are an anti-pattern for exactly this reason, because the dashboard shows the overspend only once it's already happened.
Budget enforcement belongs at the gateway, not scattered across application code. The gateway stops it structurally, not by someone noticing in time.
The ledger's value grows the more granularly it can be queried. Security teams want spend by key, to catch usage patterns that suggest a credential has been compromised or misused.
How a per-team LLM spend dashboard serves different stakeholders
A per-team LLM spend dashboard is a set of role-specific views built on the same underlying telemetry, and each view answers a different operational question for the person looking at it.
The engineering leader's view shows spend by team, project, and model over time. The actionable output: spot teams whose cost is growing faster than their usage, a sign of prompt bloat, model over-selection, or a retry loop, and step in before the next billing cycle closes.
The finance stakeholder's view shows committed spend against actual spend, broken down by provider and model. The actionable output is a mid-month reforecast instead of an end-of-month surprise, because finance can see the trajectory before the ceiling arrives.
The security team's view shows spend by virtual key with anomaly detection layered on top. The signals are tokens per key per hour, where spikes point to misuse or a compromised credential, new model access patterns where a key suddenly starts calling a model it's never touched before, and cost acceleration curves. This connects directly to the LLMjacking threat model: stolen provider keys get drained for inference or resold, producing large, sudden cost spikes, while virtual keys scoped to a team and budget are rate-limited and can be revoked instantly without rotating the underlying provider credential.
The model routing view shows cost against quality by task type. The question: is the model mix optimal, or are teams defaulting to frontier models for tasks a cheaper model would handle just as well? This view only exists because of routing-layer telemetry. The actionable output: show a team routing every classification task to a frontier model a routing policy that redirects those calls to a budget tier, with projected savings calculated from their own historical token counts.
Budget enforcement at the routing layer
A spend dashboard built on routing-layer telemetry only functions as a control surface if the gateway can enforce budget limits at request time, before the provider has already charged for the call.
The enforcement model checks the budget before the provider call, not after the response comes back. Budget state lives in fast counters, checked synchronously during the policy stage of the request, before the route decision gets made. A team that's exhausted its monthly allocation gets a 429 at the gateway. The provider never sees the request. No cost gets incurred. A bug in a retry loop can burn through a month's budget in minutes, so hierarchical budget controls need hard enforcement that blocks requests once thresholds are exceeded, catching it before someone else does.
The objection to this is predictable: teams need uninterrupted access to models, and a hard block sounds like it would break production. Tiered thresholds answer that directly. None of this is a surprise outage. It's a graduated, predictable sequence that gives a team room to notice and react before anything actually stops.
Enforcement also creates the feedback loop that makes the dashboard worth checking, since when teams know budget limits are enforced at the gateway, they actually look at their spend dashboard. That changes the dynamic between finance and engineering: budgets can be set with confidence, because the system holds them, rather than treated as advisory numbers everyone quietly ignores.
Governance at scale across teams and projects
The routing-layer telemetry model scales to many teams and projects without any architectural rework, because the identity of the requester, and therefore the attribution, is encoded in the virtual key.
Adding a new team or project becomes a configuration act. Issue a new virtual key scoped to that team's budget, model access, and rate limits, and the gateway starts attributing every request from that key to the new team immediately. No new integration code. A virtual key can be restricted to specific models, budgets, or request types, and keys rotate at the gateway without downtime, so provider keys get rotated without touching application code.
RBAC determines who can see and act on telemetry for each team. Team leads see their own team's spend. Enterprise governance, meaning RBAC, workspaces, and audit logs, is the capability set that keeps shadow AI from spreading inside organizations that believe governance is already in place.
This removes the manual credential management that produces shadow AI in the first place: developers who can't get a virtual key through the proper channel stop worrying about governance and use a personal API key instead.
Governance features gated behind enterprise pricing tiers are the scaling risk. The implication for choosing a gateway: governance capabilities need to be available from day one, at any scale, not unlocked only once a contract crosses some enterprise threshold.
Gateway criteria for routing-layer telemetry
Not every gateway that advertises observability actually delivers the telemetry granularity needed for per-team spend attribution. The criteria below follow directly from the architecture laid out above.
Attribution granularity comes first: can the gateway emit per-request records tagged with team, project, virtual key, model, provider, input tokens, output tokens, and cache hit? Ask what fields actually make up the usage event, and whether that schema is documented and stable.
Budget enforcement, not just alerting, comes second: can the gateway reject requests once a team's budget is exhausted, before the provider call goes out? Ask what happens at exactly 100% of a team's monthly budget: does traffic actually stop, or does an alert just fire while requests keep flowing?
Virtual key architecture comes third: are provider credentials held only at the gateway, with scoped virtual keys issued out to teams? Without this, attribution is a guess about which team used which key, rather than a structural fact about which key belongs to which team. It's also the security criterion that matters most: a leaked virtual key is budget-capped and revocable instantly, while a leaked provider key is not.
Real-time ledger access comes fourth: is spend data available as each request happens, or only reconstructed from periodic exports? End-of-day or end-of-month data works fine for reporting, but enforcement and the mid-month reforecast finance stakeholders need both require real-time numbers.
RBAC and workspace isolation come fifth: can spend visibility be scoped so a team lead sees only their own team's data? A dashboard showing every team's numbers to every user is a reporting tool with a privacy problem, not a governance tool.
Governance available at every scale comes sixth: RBAC, audit logs, and enforcement should be available to a seed-stage team the same way they're available to an enterprise organization, because teams that can't reach governance features at their current scale will work around them.
Concentrate AI meets these criteria as a managed LLM gateway connecting teams to more than 130 models through one unified API, keeping provider complexity in the infrastructure layer. And because it's fully managed, it removes the operational burden that self-hosted gateway software shifts onto engineering teams who would rather spend that time shipping product.